📋 Key Information Summary
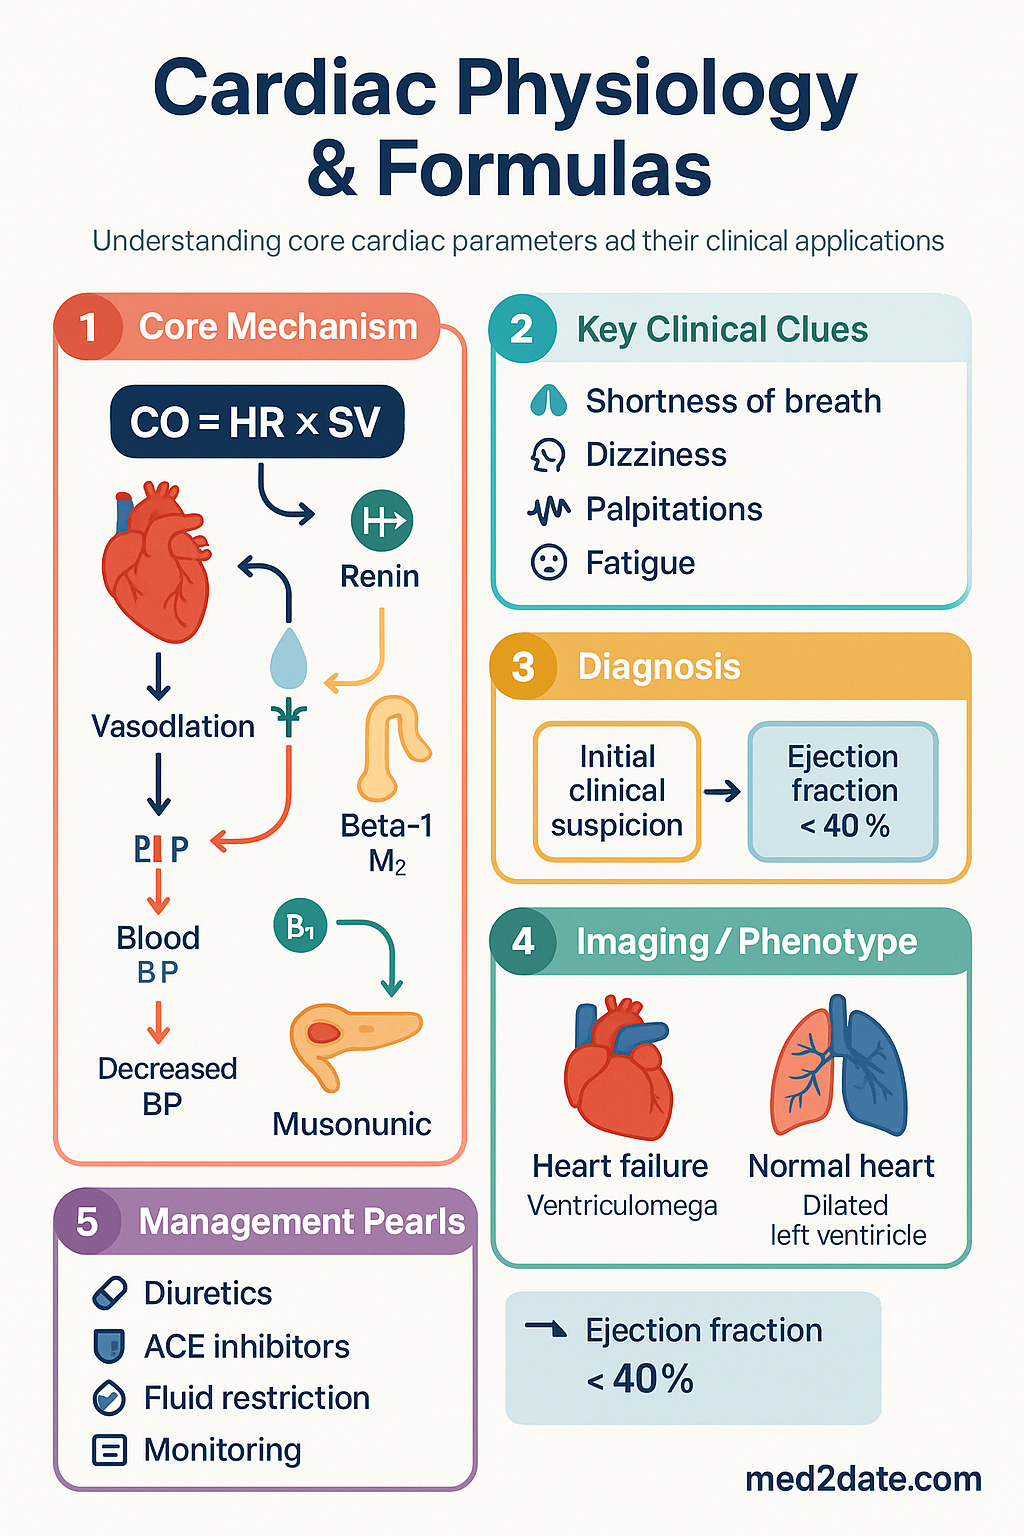
- Cardiac output (CO) = heart rate (HR) × stroke volume (SV); normal resting CO in adults is 4–8 L/min, cardiac index (CI) 2.5–4.0 L/min/m².
- Stroke volume is determined by preload, afterload, and myocardial contractility (the three determinants of SV).
- Ejection fraction (EF) = (EDV − ESV) / EDV × 100; normal EF ≥ 55%; HF with reduced EF (HFrEF) defined as EF < 40%.
- Fractional shortening (FS) = (LVIDd − LVIDs) / LVIDd × 100; normal FS 25–45%; assessed on M-mode echocardiography.
- The Fick principle states CO = VO₂ / (CaO₂ − CvO₂), used as the gold-standard invasive CO measurement.
- Mean arterial pressure (MAP) = DBP + ⅓(SBP − DBP); target MAP ≥ 65 mmHg in most critically ill patients.
- Systemic vascular resistance (SVR) = 80 × (MAP − RAP) / CO; normal SVR 800–1200 dyne·s/cm⁵.
- Pulmonary vascular resistance (PVR) = 80 × (MPAP − PCWP) / CO; normal PVR < 250 dyne·s/cm⁵.
- Stroke work (SW) = SV × (MAP − PCWP) × 0.0136; quantifies left ventricular energy expenditure per beat.
- Cardiac power output (CPO) = MAP × CO / 451; CPO < 0.6 W in cardiogenic shock is a critical prognostic threshold.
- Pressure–velocity relationships and ventriculo-arterial coupling (Ees/Ea ratio ~1.0) are central to understanding cardiac efficiency.
- All formulas assume steady-state haemodynamics; dynamic values require integration over the full cardiac cycle for accuracy.
- Invasive haemodynamic monitoring (pulmonary artery catheter) remains the reference standard for direct Fick CO measurement in Australian tertiary centres.
Introduction & Australian Context
Understanding cardiac physiology — encompassing pressure–velocity relationships, cardiac output, ejection fraction, and the Fick principle — is foundational for cardiologists, intensivists, and general physicians managing haemodynamic compromise in Australian clinical practice. These parameters underpin the diagnosis, severity assessment, and treatment of heart failure, cardiogenic shock, valvular disease, and pulmonary hypertension.
Heart failure affects an estimated 480,000 Australians, with a prevalence rising steeply with age — approximately 15% in those aged ≥ 85 years. Hospitalisation for acute decompensated heart failure represents one of the most common causes of medical admission in Australian tertiary hospitals, with the AIHW reporting over 69,000 heart failure-related separations annually. Mortality at one year following a first admission remains approximately 30%, underscoring the importance of precise haemodynamic assessment and timely intervention.
This guideline provides a comprehensive, formula-driven reference for the core parameters used in cardiac physiology, with emphasis on measurement techniques available in Australian centres, normal ranges, clinical interpretation, and integration with contemporary echocardiographic and invasive monitoring modalities.
Cardiac Output, Stroke Volume & Heart Rate
Core Definitions
Cardiac output (CO) is the volume of blood pumped by each ventricle per minute and is the product of heart rate and stroke volume:
where CO = cardiac output (L/min), HR = heart rate (beats/min), SV = stroke volume (mL/beat).
Normal resting CO: 4–8 L/min (adult)
Cardiac Index
Because CO varies with body size, cardiac index (CI) normalises output to body surface area (BSA):
Normal CI: 2.5–4.0 L/min/m²
Body surface area is most commonly estimated using the Dubois formula: BSA (m²) = 0.007184 × Height(cm)0.725 × Weight(kg)0.425. The Mosteller formula (BSA = √(Height × Weight / 3600)) provides a rapid bedside estimate.
Stroke Volume
Stroke volume is the volume of blood ejected per ventricular contraction. Normal resting SV is 60–100 mL/beat. Stroke volume is governed by three interdependent determinants:
Stroke Volume Index
Normal SVI: 33–47 mL/m²/beat
Heart Rate Regulation
Normal resting adult heart rate: 60–100 bpm. The sinoatrial (SA) node intrinsic rate is approximately 100 bpm, modulated by:
- Sympathetic stimulation: β₁-adrenergic → ↑ HR (chronotropy), ↑ contractility (inotropy), ↑ conduction velocity (dromotropy).
- Parasympathetic (vagal) stimulation: M₂ muscarinic → ↓ HR, ↓ AV conduction.
- Intrinsic factors: stretch, catecholamines, temperature, electrolytes (K⁺, Ca²⁺).
Pressure–Velocity Relationships & the Fick Principle
The Fick Principle
Adolf Fick (1870) described that the uptake or release of a substance by an organ equals the arteriovenous difference of that substance multiplied by blood flow. Applied to oxygen:
VO₂ = oxygen consumption (mL O₂/min), typically ~250 mL/min at rest in a 70 kg adult.
CaO₂ = arterial oxygen content (mL O₂/dL blood)
CvO₂ = mixed venous oxygen content (mL O₂/dL blood)
Oxygen content = (1.34 × Hb × SaO₂) + (0.003 × PaO₂)
Deriving CaO₂ and CvO₂
| Parameter | Formula | Normal Value |
|---|---|---|
| CaO₂ (arterial O₂ content) | (1.34 × Hb × SaO₂) + (0.003 × PaO₂) | 16–20 mL O₂/dL |
| CvO₂ (mixed venous O₂ content) | (1.34 × Hb × SvO₂) + (0.003 × PvO₂) | 12–15 mL O₂/dL |
| CaO₂ − CvO₂ (a-v O₂ difference) | — | 3.5–5.5 mL O₂/dL |
| Oxygen delivery (DO₂) | CO × CaO₂ × 10 | 900–1100 mL O₂/min |
| Oxygen extraction ratio (O₂ER) | (CaO₂ − CvO₂) / CaO₂ | 0.22–0.30 (22–30%) |
Measurement in Australian Centres
Direct Fick CO measurement requires:
- Pulmonary artery catheter (Swan–Ganz) for mixed venous sampling (SvO₂ from PA port).
- Arterial blood gas or arterial line sampling for SaO₂/PaO₂.
- Metabolic cart for VO₂ (available in all Level 6 ICUs in Australia).
In practice, the thermodilution method (injectate-based or continuous) is more commonly used at the bedside in Australian tertiary ICUs and cardiac catheterisation laboratories, as it does not require VO₂ measurement. However, thermodilution remains calibrated against the Fick principle and is unreliable in the presence of significant tricuspid regurgitation or intracardiac shunts.
Pressure–Velocity Relationships
The relationship between ventricular pressure development and ejection velocity characterises myocardial performance. Key concepts include:
- dP/dtmax: Maximum rate of pressure rise during isovolumetric contraction; normally > 1200 mmHg/s. Reduced in systolic dysfunction; measured invasively or estimated from mitral regurgitation jet on Doppler echocardiography.
- Vmax: Theoretical maximum velocity of shortening at zero load; an index of contractility.
- Vcf (velocity of circumferential fibre shortening): Vcf = (LVIDd − LVIDs) / (LVIDd × ET), where ET = ejection time. Corrected Vcf (Vcfc) adjusts for heart rate.
Ventriculo-Arterial Coupling
Optimal cardiac efficiency occurs when ventricular elastance (Ees) is approximately equal to arterial elastance (Ea):
Ees = ESP / ESV (end-systolic pressure / end-systolic volume)
Optimal coupling: Ees / Ea ≈ 1.0 (range 0.6–1.2)
Decoupling (Ees/Ea < 0.6) → impaired cardiac efficiency, seen in advanced systolic heart failure.
Ejection Fraction & Fractional Shortening
Ejection Fraction (EF)
Ejection fraction is the most widely used clinical measure of left ventricular systolic function. It represents the proportion of end-diastolic volume ejected per beat:
Equivalently: EF = SV / EDV × 100%
Normal EF: ≥ 55%
EDV = end-diastolic volume (normal ~120 mL)
ESV = end-systolic volume (normal ~50 mL)
SV = EDV − ESV (normal ~70 mL)
Heart Failure Classification by EF
Measurement Methods
| Modality | Method | Accuracy | Australian Availability |
|---|---|---|---|
| Transthoracic Echo (TTE) | Simpson's biplane (MOD) | Good (± 10%) | All hospitals; MBS item 55117 |
| CMR (Cardiac MRI) | Cine SSFP volumetric | Gold standard (± 5%) | Tertiary centres; MBS item 63339 |
| Nuclear (MUGA/RNVG) | Gated blood pool | Excellent (± 3–5%) | Selected centres; MBS item 61314 |
| CT angiography | Retrospective gating | Good | Widely available |
| Invasive angiography | Ventriculography | Moderate (foreshortening) | Cath labs |
Fractional Shortening (FS)
Fractional shortening is a one-dimensional (linear) surrogate for ejection fraction, measured by M-mode echocardiography at the level of the papillary muscles:
LVIDd = left ventricular internal dimension in diastole (normal 3.9–5.3 cm)
LVIDs = left ventricular internal dimension in systole (normal 2.0–4.0 cm)
Normal FS: 25–45%
Relationship Between EF and FS
Under the assumption of a prolate ellipsoid geometry, EF and FS are related by the cube function:
For FS = 35%: EF ≈ 1 − 0.65³ ≈ 1 − 0.274 ≈ 73%
For FS = 25%: EF ≈ 1 − 0.75³ ≈ 1 − 0.422 ≈ 58%
This relationship degrades with abnormal geometry (e.g., aneurysm, asymmetric hypertrophy).
Haemodynamic Parameters
Pressure Parameters
| Parameter | Formula / Definition | Normal Range |
|---|---|---|
| Mean Arterial Pressure (MAP) | MAP = DBP + ⅓(SBP − DBP) | 70–105 mmHg |
| Pulse Pressure (PP) | PP = SBP − DBP | 30–50 mmHg |
| Right Atrial Pressure (RAP) | CVP (central venous pressure) | 2–8 mmHg |
| Pulmonary Artery Systolic (PASP) | Invasive PA catheter / echo estimate | 15–30 mmHg |
| Mean PA Pressure (MPAP) | ⅓(PASP) + ⅔(PADP) | 9–18 mmHg |
| Pulmonary Capillary Wedge Pressure (PCWP) | Reflects LA/LVEDP | 6–12 mmHg |
| Left Ventricular End-Diastolic Pressure (LVEDP) | Invasive measurement | 5–12 mmHg |
Resistance Parameters
SVR = 80 × (MAP − RAP) / CO
Normal SVR: 800–1200 dyne·s/cm⁵
SVR units Wood units: (MAP − RAP) / CO = 10–20 WU
Pulmonary Vascular Resistance (PVR)
PVR = 80 × (MPAP − PCWP) / CO
Normal PVR: < 250 dyne·s/cm⁵
PVR in Wood units: (MPAP − PCWP) / CO = 0.25–2.5 WU
Derived Work and Power Parameters
| Parameter | Formula | Normal / Interpretation |
|---|---|---|
| Stroke Work (SW) | SW = SV × (MAP − PCWP) × 0.0136 | Normal LVSW: 5–10 g·m/beat |
| Stroke Work Index (SWI) | SWI = SVI × (MAP − PCWP) × 0.0136 | Normal LVSWI: 40–60 g·m/m² |
| Cardiac Power Output (CPO) | CPO = (MAP × CO) / 451 | Normal: 1.0–1.7 W |
| Cardiac Power Index (CPI) | CPI = (MAP × CI) / 451 | Normal: 0.54–0.79 W/m² |
| Rate-Pressure Product (RPP) | RPP = HR × SBP | Index of myocardial O₂ demand; target < 20,000 at peak exercise |
Ventriculo-Arterial Coupling in Detail
The ratio of ventricular to arterial elastance (Ees/Ea) determines the efficiency of energy transfer from the ventricle to the arterial system:
- Normal coupling (Ees/Ea ≈ 1.0): Maximal stroke work and optimal efficiency (~90% potential energy converted to external work).
- Uncoupling with low Ees (Ees/Ea < 0.6): Systolic heart failure, reduced contractility relative to afterload. Excessive potential energy wasted; poor efficiency.
- Uncoupling with high Ees (Ees/Ea > 1.6): Concentric hypertrophy (e.g., hypertensive heart disease, HOCM). Near-maximal work but reduced adaptability to preload changes; increased myocardial oxygen demand.
Integrated Haemodynamic Profile — Clinical Application
Systematic interpretation of haemodynamics requires integrating pressure, flow, and resistance data:
| Clinical Scenario | CO/CI | PCWP | SVR | Key Feature |
|---|---|---|---|---|
| Cardiogenic shock | ↓↓ (< 2.2) | ↑↑ (> 18) | ↑↑ (> 1500) | Compensatory vasoconstriction |
| Septic shock | ↑ or Normal | ↓ or Normal | ↓↓ (< 800) | Vasoplegia, high output |
| Hypovolaemic shock | ↓↓ | ↓↓ (< 6) | ↑↑ | Low filling pressures |
| Tamponade | ↓↓ | ↑ (equalised) | ↑ | Equalisation of diastolic pressures |
| Acute mitral regurgitation | ↓ (effective CO) | ↑↑ (v waves) | ↑ | Large v waves on PCWP tracing |
| High-output failure | ↑↑ (> 4.0) | ↑ | ↓↓ | Thyrotoxicosis, AV fistula, sepsis |
Aboriginal and Torres Strait Islander Health Considerations
Special Populations
Clinical Application & Interpretation
Quick Reference: Core Formulas
Stepwise Haemodynamic Assessment
Common Pitfalls in Formula Application
- Indexing errors: Always confirm whether the output is indexed (CI, SVI, SWI) or absolute (CO, SV, SW). Mixing these leads to significant misinterpretation.
- Thermodilution in tricuspid regurgitation: Overestimates CO by 20–50%; use Fick method instead.
- FS in regional wall motion abnormalities: One-dimensional measurement may miss dyssynchrony; always correlate with 2D assessment.
- Assumed VO₂ in Fick: Using estimated VO₂ in critically ill patients (e.g., sepsis, burns, hypermetabolic states) introduces significant error; direct calorimetry is preferred.
- SVR in high-output states: Low SVR may be misinterpreted as "good" if CO is not simultaneously elevated.
📚 References
- 1. National Heart Foundation of Australia and Cardiac Society of Australia and New Zealand. Guidelines for the prevention, detection, and management of heart failure in Australia 2018. Heart Lung Circ. 2018;27(10):1123–1208.
- 2. McDonagh TA, Metra M, Adamo M, et al. 2021 ESC Guidelines for the diagnosis and treatment of acute and chronic heart failure. Eur Heart J. 2021;42(36):3599–3726.
- 3. Sagawa K, Suga H, Shoukas AA, Bakalar KM. End-systolic pressure/volume ratio: a new index of ventricular contractility. Am J Cardiol. 1977;40(5):748–753.
- 4. Borlaug BA, Kass DA. Ventricular-arterial coupling in heart failure. In: Heart Failure: A Companion to Braunwald's Heart Disease. 4th ed. Elsevier; 2020.
- 5. Australian Institute of Health and Welfare (AIHW). Heart, stroke and vascular disease — Australian facts. AIHW, Canberra. 2023.
- 6. Lang RM, Badano LP, Mor-Avi V, et al. Recommendations for cardiac chamber quantification by echocardiography in adults: an update from the American Society of Echocardiography and the European Association of Cardiovascular Imaging. J Am Soc Echocardiogr. 2015;28(1):1–39.e14.
- 7. Mebazaa A, Combes A, van Diepen S, et al. Management of cardiogenic shock complicating myocardial infarction. Intensive Care Med. 2018;44(6):760–773.
- 8. Remppis A, Andre F, Brado O, et al. Cardiac MRI for assessment of myocardial viability. Curr Cardiol Rep. 2020;22(12):168.
- 9. RHDAustralia (RHD Australia). The 2020 Australian guideline for prevention, diagnosis and management of acute rheumatic fever and rheumatic heart disease. 3rd ed. Menzies School of Health Research, Darwin; 2020.
- 10. Simonneau G, Montani D, Celermajer DS, et al. Haemodynamic definitions and updated clinical classification of pulmonary hypertension. Eur Respir J. 2019;53(1):1801913.
- 11. Cecconi M, De Backer D, Antonelli M, et al. Consensus on circulatory shock and hemodynamic monitoring. Task force of the European Society of Intensive Care Medicine. Intensive Care Med. 2014;40(12):1795–1815.
- 12. Nagueh SF, Smiseth OA, Appleton CP, et al. Recommendations for the evaluation of left ventricular diastolic function by echocardiography: an update from the American Society of Echocardiography and the European Association of Cardiovascular Imaging. J Am Soc Echocardiogr. 2016;29(4):277–314.